boxplots: Interpretation of 2-Sample Boxplots
Name:
boxplotsType:
Preview:
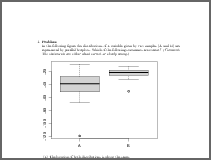
In the following figure the distributions of a variable given by two samples (A and B) are represented by parallel boxplots. Which of the following statements are correct? (Comment: The statements are either about correct or clearly wrong.)

- False. Distribution B has on average higher values than distribution A.
- False. There are observations which deviate more than 1.5 times the interquartile range from the box.
- True. The interquartile range in sample A is clearly bigger than in B.
- True. The skewness of both distributions is similar, both are about symmetric.
- False. Distribution A is about symmetric.
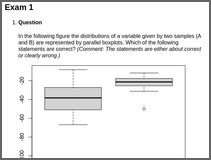
In the following figure the distributions of a variable given by two samples (A and B) are represented by parallel boxplots. Which of the following statements are correct? (Comment: The statements are either about correct or clearly wrong.)

- True. Both distributions have a similar location.
- True. Both distributions have no observations which deviate more than 1.5 times the interquartile range from the box.
- False. The interquartile range in sample A is not clearly bigger than in B.
- True. The skewness of both distributions is similar, both are left-skewed.
- False. Distribution B is left-skewed.
In the following figure the distributions of a variable given by two samples (A and B) are represented by parallel boxplots. Which of the following statements are correct? (Comment: The statements are either about correct or clearly wrong.)

- False. Distribution B has on average higher values than distribution A.
- False. There are observations which deviate more than 1.5 times the interquartile range from the box.
- False. The interquartile range in sample A is not clearly bigger than in B.
- True. The skewness of both distributions is similar, both are about symmetric.
- True. Distribution B is about symmetric.
Description:
Parallel boxplots in a 2-sample problem need to be compared regarding their location, scale, skewness, symmetry, and outliers. Data are drawn randomly from a suitable data-generating process so that each multiple-choice item is either about correct or clearly wrong.
Solution feedback:
Yes
Randomization:
Random numbers, text blocks, and graphics
Mathematical notation:
No
Verbatim R input/output:
No
Images:
Yes
Other supplements:
No
PDF:

HTML:

Demo code:
library("exams")

set.seed(403)
exams2html("boxplots.Rmd")
set.seed(403)
exams2pdf("boxplots.Rmd")

set.seed(403)
exams2html("boxplots.Rnw")
set.seed(403)
exams2pdf("boxplots.Rnw")