relfreq: Interpretation of Relative Frequency Tables
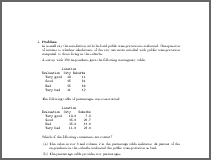
relfreqIn a small city the satisfaction with the local public transportation is evaluated. One question of interest is whether inhabitants of the city are more satisfied with public transportation compared to those living in the suburbs.
A survey with 250 respondents gave the following contingency table:
Location
Evaluation City Suburbs
Very good 19 11
Good 45 31
Bad 25 66
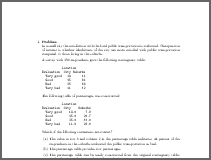
Very bad 11 42The following table of percentages was constructed:
           Location
Evaluation  City    Suburbs
  Very good    19.0     7.3
  Good         45.0    20.7
  Bad          25.0    44.0
  Very bad     11.0    28.0
Which of the following statements are correct?
In the percentage table, the column sums are about 100 (except for possible rounding errors). Hence, the table provides column percentages, i.e., conditional relative frequencies for satisfaction level given location type.
- True. This is the correct interpretation for column percentages.
- False. The row sums are not equal to 100.
- False. This calculation yields total percentages. But the table provides column percentages.
- False. This is an interpretation for row percentages, but the table provides column percentages.
- True. The column sums are equal to 100 (except for possible rounding errors).
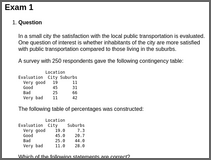
In a small city the satisfaction with the local public transportation is evaluated. One question of interest is whether inhabitants of the city are more satisfied with public transportation compared to those living in the suburbs.
A survey with 250 respondents gave the following contingency table:
           Location
Evaluation  City Suburbs
  Very good   20      13
  Good        42      26
  Bad         32      60
  Very bad     6      51
The following table of percentages was constructed:
           Location
Evaluation  City    Suburbs
  Very good    20.0     8.7
  Good         42.0    17.3
  Bad          32.0    40.0
  Very bad      6.0    34.0
Which of the following statements are correct?
In the percentage table, the column sums are about 100 (except for possible rounding errors). Hence, the table provides column percentages, i.e., conditional relative frequencies for satisfaction level given location type.
- True. The column sums are about equal to 100 (except for possible rounding errors).
- False. This is an interpretation for row percentages, but the table provides column percentages.
- False. The row sums are not equal to 100.
- True. This calculation yields column percentages.
- False. This is an interpretation for total percentages, but the table provides column percentages.
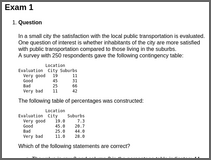
In a small city the satisfaction with the local public transportation is evaluated. One question of interest is whether inhabitants of the city are more satisfied with public transportation compared to those living in the suburbs.
A survey with 250 respondents gave the following contingency table:
           Location
Evaluation  City Suburbs
  Very good   21      14
  Good        47      29
  Bad         27      55
  Very bad     5      52
The following table of percentages was constructed:
           Location
Evaluation  City    Suburbs
  Very good    60.0    40.0
  Good         61.8    38.2
  Bad          32.9    67.1
  Very bad      8.8    91.2
Which of the following statements are correct?
In the percentage table, the row sums are about 100 (except for possible rounding errors). Hence, the table provides row percentages, i.e., conditional relative frequencies for location given satisfaction level.
- True. This calculation yields row percentages.
- True. This is the correct interpretation for row percentages.
- True. The row sums are equal to 100 (except for possible rounding errors).
- True. This is the correct interpretation for row percentages.
- False. The column sums are not equal to 100.
Demo code:
library("exams")

set.seed(403)
exams2html("relfreq.Rmd")
set.seed(403)
exams2pdf("relfreq.Rmd")

set.seed(403)
exams2html("relfreq.Rnw")
set.seed(403)
exams2pdf("relfreq.Rnw")